
2021 Q1 Market and Economic Outlook
2021 Q1 Market and Economic Outlook
The economy looks robust. Jill Mislinski reports that March Markit Service PMI (purchasing manager index, which is an indicator of future growth) expanded at the fastest pace on record. This was confirmed by the Institute for Supply Management’s PMI survey.[1] The “Big Four” economic indicators were all positive in March after a couple stumbled in February. April’s employment report was a big disappointment, with about 75% fewer new jobs than expected and when combined with revisions to prior data, with fewer jobs than previously reported. Still, on balance the economy looks strong, with people generally optimistic about reopening. Many states are relaxing or getting rid of restrictions, without seeing a significant uptick in virus cases. www.Worldometer.com reports that the US 7-day average of new cases has fallen by 36% over the last three weeks, and 82% from the peak.[2]
Valuation continues to present challenges to investors who care about such things. The trends I highlighted in my last economic outlook have persisted into this year. Market valuations look even more stretched than they were a few months ago. That said, there seems to be a shift in market leadership. Much of what worked well last year has not done as well this year. For instance, CLOU, a cloud computing ETF is up 57% over the last year, but is down 2% year to date in 2021. A broad China fund has very similar numbers. A solar stock fund (TAN) is up 176% over the last year, but down 19% YTD. ARKK, a thematic ETF that invests in mostly non-profitable and very expensive tech stocks, is up 122% over the last year, but down 3% YTD.[3] Growth has been outperforming value by more than at any point before, both in terms of duration and intensity. This reversed, starting in November. Value has significantly outperformed growth all over the world over the last six months. I have been predicting this for some time, as the value stock discount to growth stocks was at a record level. This six-month period of strong outperformance may be only the beginning after ten years of large underperformance. The MSCI World Value index still trades at a 51% discount to the Growth Index, much closer to the 53% discount it was at the end of last year than the 28% it has averaged over the last twenty-four years.[4]
Last quarter I shared a chart with four valuation-based ways of looking at the S&P 500. This month I will share a couple others. This first is called the Buffett Indicator because Warren Buffett has said in the past it is his favorite indicator of stock market valuation. It simply compares the value of all publicly traded companies to the size of the economy. I see two things noteworthy – first is that the recent reading is by far the highest on record, and second, that rise over the last four quarters is unprecedented, and only approximated by the final push of the tech bubble. To be fair, the denominator in this case is temporarily lower due to the government mandated shutdowns over the last year, which reduced economic activity. That exaggerates the spike somewhat.

Source: www.advisorperspectives.com/dshort/updates
This next chart shows the long-term trend in the S&P 500, the ten-year earnings multiple, and then trend in the earnings multiple. It is a busy chart, but contains a lot of great information.
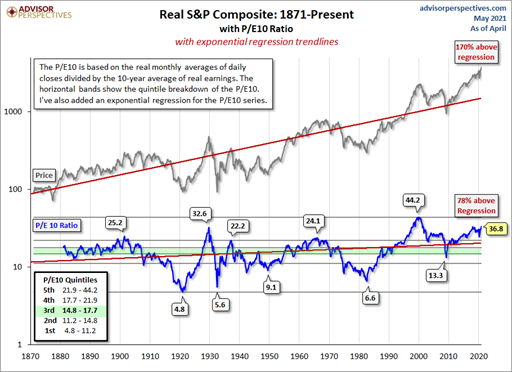
Source: www.advisorperspectives.com/dshort/updates
My purpose in showing different charts is not that the ones from last quarter are no longer relevant, but to provide some variety. Ultimately, all of the valuation-based metrics are telling the same story – the market is wildly overvalued. The Q ratio, which measures the market value relative to replacement cost, is 310% above its mean, roughly double the excess from the tech bubble.[5] S&P 500 price to book value is at 4.5x, 61% above its median level since 2000 (a period with historically high valuations.) The price to sales ratio is even more extreme, at 101% above its median, and 67% higher than one year ago. It is well above its tech bubble high.[6] [7]
Insider buying and selling gives a good picture into what executives and top managers think of a company’s stock price relative to its underlying value. It is true that there are many reasons insiders sell and only one reason they buy. Consequently, looking at the ratio of selling to buying is much more instructive than looking at absolute numbers. Jesse Felder noted that insider selling relative to insider buying peaked right as the COVID crash happened – insiders were quick to sell shares of their own companies as they saw the damage unleashed on the economy. After the market crashed, they quickly reversed course and brought the ratio down to a multi-year low. They were optimistic in their own companies’ ability to navigate the lockdowns. In both cases they were correct, as people with the most knowledge of their own companies tend to be. Since then, the stock market has risen rapidly, and insiders have been taking gains. The ratio of insider selling is much higher than even in the initial stages of COVID lockdowns.[8] The rest of the market is not following along with the corporate insiders. The AAII sentiment survey showed bulls outnumbering bears 56.9% to 20.4%, a three-year high, and short interest in S&P components is near a two-decade low.[9] This could be due to shortsellers being attacked by gangs of novice individual investors colluding to take very aggressive leveraged positions in troubled and heavily shorted companies with no apparent regard for price. If the game is no longer played according to rules of logic, the shortsellers are better off not playing. The problem is that short selling is a counterweight to rampant speculation. Without shortsellers, there is no limit to the irrational exuberance or outright manipulation of stock prices. Nonsensical stock prices may seem like a boon to investors, but there are only two ways these can be converted to actual cash. The first is through positive cash flow from the owned companies and the second is from selling to other buyers. If the underlying companies are deeply troubled or if stock prices trade at many decades or even centuries worth of cash flows, this first option is not realistic. If the companies’ cash flow is insufficient to generate a meaningful return for investors, the only option is to sell to other investors, but this is just kicking the can down the road. The game looks good on paper, but it collapses once people try to spend their paper gains. (The same could be said for cryptocurrencies, which confer no benefits to the owners, but these at least have some chance of holding value if everyone arbitrarily agrees that they are valuable.)
John Hussman built a model that was very effective at predicting subsequent annualized twelve-year return using just a few variables. While backfitting may have flattered the model’s effectiveness, and while it did not do well at predicting 12 year forward returns for 1999-2006, it is still worth noting that we are at the third worst point for equity returns relative to treasury yields, even as Treasury yields are not too far off all-time lows. He also shows that five of the most accurate (historically, at least) predictors of future returns are all at their highest valuations in at least 75 years.[10]
Home prices have been rising at greater than base inflation for years, and generally at a higher rate than rents. In the last year, home price inflation has accelerated, while rent inflation has decelerated almost to zero.[11] While this could be explained by lower mortgage rates, it also shows investors (landlords) willing to accept a lower rate of return. This aligns with higher asset pricing generally. I do not see a housing bubble similar to the one of the last decade, which was fueled by speculative frenzy of “house flippers”. This is probably because speculating on homes is much more work and requires more time for lower expected returns than using a video game-like app to purchase options on a non-profitable story stock or to speculate on crypto or NFTs.
Signs of rampant speculation are everywhere. SPACs are being issued at an alarming rate. These “blank check” companies give fund managers cash to go buy a company. Shareholders then have a chance to redeem if they want. Investors dumping money into a mystery investment does not speak well of their diligence in general. If this were only going to superstar private equity managers that would be one thing. Instead, retired athletes and celebrities are the face of many of these “trust me” investments. For a little perspective on the SPAC trend, from 2009-2019, there were 226 SPAC IPOs for $47 billion. In 2020, there were 248 for $83 billion, and so far in 2021, there have been 315 for $102 billion, and another 273 that have already filed for an IPO. 426 SPACs that went public since 2019 are currently searching for deals – private companies to buy.[12] In 2020, total funds raised through SPAC offerings exceeded IPO sales for the first time. This is not because IPOs have gone out of fashion and are being replaced by SPACs. The $78.2B raised in IPOs in 2020 is second only to 2014, going back to 2011. The IPO total of 2021 of $89.4B is already the biggest year of at least the last eleven years.[13]
Non-Fungible Tokens and Collectibles – usually items become collectibles because people genuinely love them and have fun collecting.[14] Kids start collecting stamps, or baseball cards, or coins. If people are still passionate about their collection as they grow in financial means, they can either buy more rare and desirable items or move into new areas to collect. Wealthy people may collect artwork, cars, historical artifacts, etc. Collectibles become valuable when they are both highly desirable and rare. Museums are willing to pay handsomely for rare artifacts and rare art that the public will pay to come see. Individuals will pay for the “must have” piece for their collection. Wealthy individuals will pay huge sums for rare and famous works because they can. William Randolph Hearst collected paintings, sculptures, fireplaces, ceilings and floors and had them incorporated into his magnificent Hearst Castle. While it is possible to get rich through holding collectibles, the normal course is to get rich first and then buy collectibles. Two current trends in collectibles point to the speculative frenzy dominating our world. The first is something called Non-Fungible Tokens, or NFTs. A detailed explanation is beyond the scope of this update, but the short version is an NFT is a computer file, typically an image, that is recorded on a blockchain as belonging to a particular owner. Owning an NFT does not confer ownership of the intellectual property, which is generally retained by the creator. It does not give exclusive use – the image or video is still widely available to anyone. The copy owned by the NFT holder is not differentiable from what anyone else could freely access, other than that on whatever blockchain hosts the NFT record, the owners name is recorded. Herein lies the rarity. There is only one token of that file with that specific number. Rather than just owning the equivalent to a print of a work of art, you own the “original” or one of a small series of numbered copies. If NFTs were sold for small amounts of money as a way to support artists, this whole topic would be a non-issue. Instead, they are selling for hundreds of thousand or even tens of millions of dollars each.[15] Total sales in the first quarter were over $2 billion, up over 2000% from the quarter before.[16] Another trend I am hearing about is securitizing artwork and other collectibles, including NFTs. For instance, a shoe prototype worn by Kanye West just sold for $1.8 million, shattering the record for the most expensive pair of shoes. If this was just a mega-rich fan, it would be a mere curiosity, but the acquisition was by “RARES, a sneaker-investing platform.”[17] This is part of the new trend of collectibles being purchased by investment funds or platforms, and split into shares to be sold to the public. While some collectors may fork over good money for the bragging rights of owning a fraction of something they can never actually possess or use (Green Bay Packers shares have been publicly held for years), I believe the motivation of buying collectible shares or NFTs is speculation. The problem with this “Castles in the sky” approach is that it can only be profitable if someone else is willing to pay a higher price, which will only happen if that person expects another person to pay an even higher price. Ultimately, this seems doomed to collapse. Granted, one could argue the same for physical collectibles, and that is certainly a risk. At least those have the benefit of being able to be displayed and enjoyed. A vintage Aston Martin is much more likely to always have admirers than a receipt on a blockchain proving that someone owns the “original” data file. Those platforms trumpeting their ability to make rare art ownership available to the masses miss that the two benefits of owning rare art – exclusivity and ability to possess something special are both undermined.
Crypto Currencies are rallying, ostensibly in reaction to the expected inflationary effect of the creation of vast amounts of fiat money. I believe the crypto craze has much more to do with the current trend of rampant speculation. Crypto would be the ultimate fiat money, except that it is not money. Merriam Webster defines fiat money as “money (such as a paper currency) not convertible into coin or specie of equivalent value.”[18] Wikipedia has a more extensive definition: Fiat money is a currency (a medium of exchange) established as money, often by government regulation. Fiat money does not have intrinsic value and does not have use value. It has value only because a government maintains its value, or because parties engaging in exchange agree on its value. It was introduced as an alternative to commodity money (a medium which has its own intrinsic value) and representative money (money which represents something with intrinsic value).[19] Crypto proponents argue that, unlike government issued fiat currencies, crowdsourced (fiat) cryptocurrencies are limited in supply. This is simply not true. There are more than 6600 cryptocoins, with a market cap of over $2 Trillion[20] (having doubled in the first three months of this year)[21], and there is nothing stopping the creation of thousands more. That is the annual GDP of Brazil, created in three months, out of nothing (except for maybe Brazilian rainforests – the energy needs of crypto are huge). I do not claim to know how to trade cryptocurrencies, and while my base case value for these is zero, there may well be some that survive and maintain some value. My point is that the phenomenal rise in cryptocurrency creation and market value is one more sign of the environment of rampant speculation where we now live.
There are many ways people are now trying to get rich quick, armed with floods of money from the world’s central banks. When the focus of wealth creation is speculation and not work or creation and the timeframe is weeks or months and not decades, times are likely to be challenging ahead. On the other hand, there is still incredible new technology being developed, and creative new approaches being tried.
Conclusion
Nobody knows how markets will do over the short-term. Speculative frenzies can go on longer than one would think, with the best returns near the end. Current valuations do not bode well for long-term returns, and whenever speculative mania dominates careful analysis, the situation eventually ends badly. At Rothman Investment Management, we are exercising caution to protect client portfolios first in this environment and secondarily trying to earn a reasonable return. We recommend investors understand the current situation and have a plan.
Clark, M. (2021, March 11). NFTs, explained. Retrieved from The Verge: https://www.theverge.com/22310188/nft-explainer-what-is-blockchain-crypto-art-faq
ESI Analytics Limited. (2021, May 6). Bitcoin Bubble in Terminal Stage. Retrieved from Seeking Alpha: https://seekingalpha.com/article/4425243-bitcoin-bubble-in-terminal-stage?mail_subject=bitcoin-bubble-in-terminal-stage&utm_campaign=nl-macro-view&utm_content=link-0&utm_medium=email&utm_source=seeking_alpha
Felder, J. (2021, April 14). Insiders are Sending a Pretty Clear Signal About The Stock Market (And The Economy). Retrieved from The Felder Report: https://thefelderreport.com/2021/04/14/insiders-are-sending-a-pretty-clear-signal-about-the-stock-market-and-the-economy/
Frank, R. (2021, April 13). NFT sales top $2 billion in first quarter, with twice as many buyers as sellers. Retrieved from CNBC Wealth: https://www.cnbc.com/2021/04/13/nft-sales-top-2-billion-in-first-quarter-with-interest-from-newcomers.html
Hussman, J. (2021, May 4). Counting the Chickens Twice. Retrieved from Advisor Perspectives: https://www.advisorperspectives.com/commentaries/2021/05/04/counting-the-chickens-twice?bt_ee=UO26fw%2F0VrAKMnRHbqmQBQLprRf6ZjYOrIL1dp8ktYHURZKVyhkLBT8%2Bbb2wEV%2F1&bt_ts=1620158507878
Kharif, O. (2021, April 5). Crypto Market Surpasses $2Trillion After Doubling This Year. Retrieved from Bloomberg: https://www.bloomberg.com/news/articles/2021-04-05/crypto-market-cap-doubles-past-2-trillion-after-two-month-surge#:~:text=The%20total%20market%20value%20of,doubled%20in%202021%20to%20%2458%2C858.
Lavi, A. (2021, May 7). Value Stocks—Still Plenty of Fuel in the Tank. Retrieved from Advisor Perspectives: https://www.advisorperspectives.com/commentaries/2021/05/07/value-stocks-still-plenty-of-fuel-in-the-tank?bt_ee=N2bp45tOfsUbLZ6v8piyTqylwQVUHAhMfDr4H1%2B%2FsMzL%2F1VQ2NdQ4dYGYsKG%2FVA%2F&bt_ts=1620417703307
Merriam-Webster. (2021, May 7). fiat money. Retrieved from merriam-webter.com: https://www.merriam-webster.com/dictionary/fiat%20money
Mislinksi, J. (2021, May 6). Is the Market Still Overvalued? Retrieved from Advisor Perspectives: https://www.advisorperspectives.com/dshort/updates/2021/05/06/is-the-market-still-overvalued?utm_source=boomtrain&utm_medium=email&utm_campaign&utm_content&utm_term&bt_ee=mhv13AEb9ieDXX%2Fv8%2BpoTBfaoZllrndUQiNDezj7%2FhHCo2lTvYqKL2BzgT8LPWOb&bt_ts=1620391
Mislinski, J. (2021, May 5). March Markit Services PMI: "Business activity expands at fastest pace on record amid marked uptick in client demand". Retrieved from Advisor Perspectives: https://www.advisorperspectives.com/dshort/updates/2021/05/05/march-markit-services-pmi-business-activity-expands-at-fastest-pace-on-record-amid-marked-uptick-in-client-demand?utm_source=boomtrain&utm_medium=email&utm_campaign&utm_content&utm_term&bt_ee=b
Piard, F. (2021, April 10). Weekly Update for 4/12/2021. Retrieved from Seeking Alpha: https://seekingalpha.com/research/2496631-fred-piard/5577480-weekly-update-for-4-12-2021?mail_subject=quantitative-risk-value-weekly-update-for-4-12-2021&utm_content=link-0&utm_medium=email&utm_source=seeking_alpha
Rieder, R. (2021, April 8). In Unprecedented Times, Don't Rely on (Obvious) Precedent. Retrieved from Advisor Perspectives: https://www.advisorperspectives.com/commentaries/2021/04/08/in-unprecedented-times-dont-rely-on-obvious-precedent?bt_ee=QWQ1KCKEBLMq%2B1KvVO5%2BLEMaBXn%2B%2BhIyOksmvy7UCsL%2BWwF1jhcyTSj51yIAorVl&bt_user_id&bt_ts=1617912120615
SPAC Insider. (2021, May 7). SPAC Statistics. Retrieved from SPAC Insider: https://spacinsider.com/stats/
Wikipedia. (2021, 05 07). Fiat Money. Retrieved from wikipedia: https://en.wikipedia.org/wiki/Fiat_money
Williams, A. (2021, April 26). A pair of shoes Kanye West wore at the Grammys in 2008 just broke the record for the most valuable sneaker sale ever. Retrieved from Business Insider: https://www.businessinsider.com/kanye-west-yeezy-shoes-grammys-break-sneaker-sales-record-auction-2021-4
Disclaimers:
The views expressed are the views of Jacob Rothman on behalf of Rothman Investment Management, LLC (RIM) through the period ending March 31, 2021 unless otherwise specifically indicated and are subject to change at any time based on market and other conditions. All financial information in this newsletter is as of March 31, 2021 unless otherwise specifically indicated. Due to various factors, including changing market conditions, such information may no longer be reflective or current position(s) and/ or recommendation(s). Therefore, no client or prospective client should assume that any such discussion serves as a substitute for personalized advice from Rothman Investment Management, LLC.
This newsletter is for informational purposes only and is not to be considered investment advice. The information herein should not be considered a recommendation to purchase or sell any particular security. The securities and strategies discussed herein are meant to be examples of RIM investment approach but do not represent an entire portfolio or the performance of a Fund or Strategy and in aggregate may only represent only a small percentage of the portfolio holdings. It should not be assumed that any of the securities discussed were or will prove to be profitable, or that the investment recommendations or decisions made by RIM in the future will be profitable. Past performance is not necessarily indicative of future results. No current or prospective client should assume that future performance of any specific investment, investment strategy or product made reference to directly or indirectly in this letter or indirectly via a link to an unaffiliated third party web site, will be profitable or equal the corresponding indicated performance levels. Different types of investments involve varying degrees of risk, and there can be no assurance that any specific investment will either be suitable or profitable for a client or prospective client’s investment portfolio. Historical results for investment indices and/or categories generally may not reflect the deduction of transaction and/or custodial charges, nor the deduction of an investment management fee, the incurrence of which would have the effect of decreasing historical results.
The benchmark for US Large Capitalization stocks is the S&P 500 Net of total returns, a market capitalization weighted index containing the 500 most widely held companies.
[1] (Mislinski, 2021)
[2] As of May 7, 2021
[3] Data from finance.yahoo.com
[4] (Lavi, 2021)
[5] (Mislinksi, 2021)
[6] The price to sales ratio looks worse than some other ratios because corporate profit margins are higher now than historically. These are usually cyclical, and the major contributing factors are labor cost, taxes and interest. All of these are low, but all may trend higher. Input costs (commodities) also have been rising and companies may not be able to pass these along. Historically, profit margins have been cyclical, making it hard to grow profits at a strong rate when margins are already well above average, as now.
[7] Data sourced from www.multpl.com. Calculations done by Rothman Investment Management.
[8] (Felder, 2021)
[9] (Piard, 2021)
[10] (Hussman, 2021)
[11] (Rieder, 2021)
[12] (SPAC Insider, 2021)
[13] (Renaissance Capital, 2021)
[14] Perhaps the most impressive, though not particularly valuable, collections of collections I’ve seen was at the House On the Rock in Spring Green, Wisconsin. I recommend it. One of the most interesting stories about a collector was in the book, “The Man Who Loved Books Too Much” about a rare book thief.
[15] (Clark, 2021)
[16] (Frank, 2021)
[17] (Williams, 2021)
[18] (Merriam-Webster, 2021)
[19] (Wikipedia, 2021)
[20] (Kharif, 2021)
[21] (ESI Analytics Limited, 2021)